Hansen’s disease is still an important public health problem in Brazil and in many developing countries. Even with all efforts undertaken to achieve elimination, the disease has been causing a high number of disabled individuals in countries such as Brazil and India. In 2014, 6.6% (more than 14,000 individuals) of all newly-diagnosed cases in the world already had permanent physical disabilities and a rate of 2.0 disabled per million inhabitants.1 In 2016, Brazil registered a rate of grade II of 8.42/million inhabitants. Besides, 7.9% of new cases already had that grade of disability.2
In this context, the WHO, when launching the Global Leprosy Strategy 2016-2020 in 2016, established two goals (of the three in the document) related to prevention of physical disabilities: Elimination of grade II among pediatric patients with Hansen’s disease and reduction of new cases with grade II to less than one case per million inhabitants.1
Besides being a neglected disease, the relevance of the battle against Hansen’s disease relies in transcendence, i.e., in its social value. The debilitating potential resulting from neural lesions significantly increases the subjects’ vulnerability, leading to stigmatization, prejudice and exclusion.3
The evaluation of the grade of physical disability (GPD) is a practice recommended by the Ministry of Health and should be performed in all diagnosed patients. From the clinical point of view, the assessment allows analyzing the impact of the disease in the individual’s life, monitoring treatment evolution and establishing strategies for prevention, rehabilitation and self-care. In the epidemiological aspect, it allows to monitor the extent of the endemics, the hidden prevalence and the maintenance of the transmission chain, also reflecting the quality of health care services.4
The objective was to analyze the trend of the epidemiological indicators related to physical disability in Brazil, from 2001 to 2015. They were: coefficient of detection of new cases of Hansen’s disease with physical disability grade II per 100,000 inhabitants, proportion of individuals with physical disability grade II among the new cases evaluated, proportion of evaluated according to GPD at diagnosis and discharge.4
We adopted the segmented regression model (joinpoint). The trend was classified into increasing, decreasing or stationary. We obtained the Annual Percent Change (APC) and the Average Annual Percent Change (AAPC). For each trend, the confidence interval (95% CI) was calculated. We adopted a significance of 5%. The software Joinpoint version 4.5.0.1 was used.
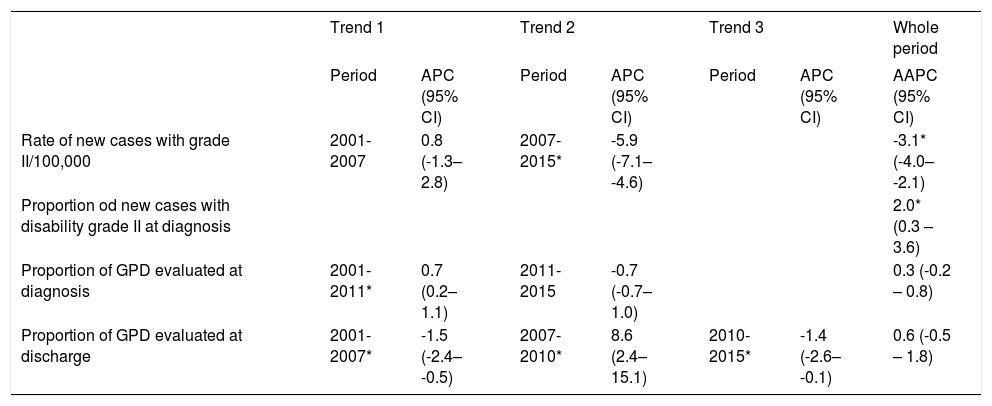
In table 1, the analysis of the trend of the analyzed indicators is seen.
Joinpoint time analysis of the epidemiological indicators related to the grade of physical disability due to Hansen’s disease. Brazil, 2001 to 2015
| Trend 1 | Trend 2 | Trend 3 | Whole period | ||||
|---|---|---|---|---|---|---|---|
| Period | APC (95% CI) | Period | APC (95% CI) | Period | APC (95% CI) | AAPC (95% CI) | |
| Rate of new cases with grade II/100,000 | 2001-2007 | 0.8 (-1.3–2.8) | 2007-2015* | -5.9 (-7.1– -4.6) | -3.1* (-4.0– -2.1) | ||
| Proportion od new cases with disability grade II at diagnosis | 2.0* (0.3 – 3.6) | ||||||
| Proportion of GPD evaluated at diagnosis | 2001-2011* | 0.7 (0.2–1.1) | 2011-2015 | -0.7 (-0.7– 1.0) | 0.3 (-0.2 – 0.8) | ||
| Proportion of GPD evaluated at discharge | 2001-2007* | -1.5 (-2.4– -0.5) | 2007-2010* | 8.6 (2.4–15.1) | 2010-2015* | -1.4 (-2.6– -0.1) | 0.6 (-0.5 – 1.8) |
Note: * Significant trend (p<0.01).
The rate of new cases with GPD II showed a decreasing trend between 2007-2015 (APC -5.9%, p<0.01) and considering the whole period of analysis (AAPC -3.1%, p<0.01). This decrease can be a result of the reduced prevalence of Hansen’s disease in Brazil or the lack of diagnosis of new cases.5 Besides, because it is a national rate, the indicator is influenced by areas of low endemicity. A more thorough analysis is necessary.
On the other hand, the proportion of news casses with GPD II at diagnosis showed an increasing trend (AAPC 2%, p<0.01). This finding reinforces the existence of a late diagnosis and little effectiveness of the activities of timely case detection, supporting the hypothesis of a high hidden prevalence.2,5
Regarding the proportion of GPD among newly-diagnosed cases, there was an increasing trend between 2001-2015. When considering the whole period, the pattern observed was stationary (AAPC 0.3%, p=0.3). The variation in the proportion of GPD evaluated at the time of discharge is highlighted. In this indicator, three significant trends were observed: the first of decrease, between 2001 and 2007 (AP -1.5%, p<0.01), the second of increase, between 2007 and 2010 (APC 8.6, p<0.01) and the third of decrease, between 2010 and 2015 (APC-1.4, p<0.01). When considering the whole period, the pattern observed was stationary.
These two indicators are capable of monitoring the quality of health services in patient care.4 Despite the improvement observed, we believe the services still have a long way to go to be able to offer an adequate care to patients, both for diagnosis and prevention of disabilities. It is important to highlight the differences between the percentages of evaluation at diagnosis, which was considered average for the period (between 75% and 90%) and at cure, considered poor (lower than 75%).
Finally, we highlight the need to implement actions that allow for improvement in health services provide an early diagnosis, timely treatment and appropriate follow-up of patients, and, therefore, achieve a sustainable and real reduction of the burden of Hansen’s disease in Brazil.
Financial support: None.
Conflict of interest: None.


